Cross-Asset Quarterly Outlook
June 2026*
Earnings Strength and Three Risks
- Global earnings remain robust, supported by accelerating AI-related investment and resilient economic activity. While higher energy prices and supply disruptions present risks, the broader growth backdrop remains constructive for pro-cyclical assets.
- A resumption of USD weakness should continue to support non-US equities and commodities, although inflation and bond market volatility warrant close monitoring.
- We maintain an equity overweight, remain neutral on rates, and stay underweight high yield credit. We also maintain an overweight in commodities through metals exposure.
Our allocations continue to favour pro-cyclical exposure despite emerging risks. In our last update in early March, we highlighted several indicators that pointed to a broad global growth upswing. Our call has been somewhat complicated by the ongoing energy supply shock, which has persisted longer than anticipated and is negatively impacting some countries and sectors. However, our optimistic outlook has so far been validated by robust global earnings growth.
Global earnings have continued to support equities (Chart 1), driven in large part by ongoing demand for AI hardware. Chart 2 highlights positive signals from Asian export data, which typically lead trailing earnings. We attribute this strength to two factors. First, US hyperscaler capex continues to grow and appears to be somewhat price-insensitive to higher energy prices (see Chart 3). Second, demand for compute remains strong and is currently accelerating. Chart 4 highlights that token expenditures have more than doubled over the past six months as agentic AI becomes increasingly widespread, driving greater demand for AI-related hardware. These trends have provided a major tailwind for the tech hardware sector. We acknowledge some short-term concerns about the sharp price appreciation in certain large technology firms; however, Chart 5 suggests that risks remain skewed to the upside, as share prices have lagged earnings upgrades.
While we continue to favour equity exposure relative to bonds, we can identify several risks that require close monitoring. The first remains the ongoing disruption to energy markets and the closure of the Strait of Hormuz. Our baseline view remains that tanker traffic will eventually normalise, preventing a severe shock. However, risks remain as oil inventories continue to decline and negotiations are ongoing. In addition, even a full reopening of the Strait of Hormuz would likely require months for tanker traffic and refinery activity to return to pre-war levels.
The second risk is inflation and the arrival of a new Fed Chair. Higher energy prices are feeding directly into headline inflation, and if they persist, second-order effects become more likely. Chart 6 highlights the recent rise in the US 10-year Treasury yield, which has coincided with reduced expectations for Fed rate cuts and higher energy prices. Our base case is that yields remain stable or potentially move lower in 2H as the energy market gradually stabilises. However, we cannot rule out a disruptive rise in bond yields. The bond market will likely test the credibility of incoming Fed Chair Warsh. Persistent above-target inflation and a healthy labour market could support politically unpopular rate hikes aimed at anchoring long-term inflation expectations. Any significant increase in rate volatility or policy uncertainty would be a headwind for markets.
Chart 1: Mar-May performance (%)
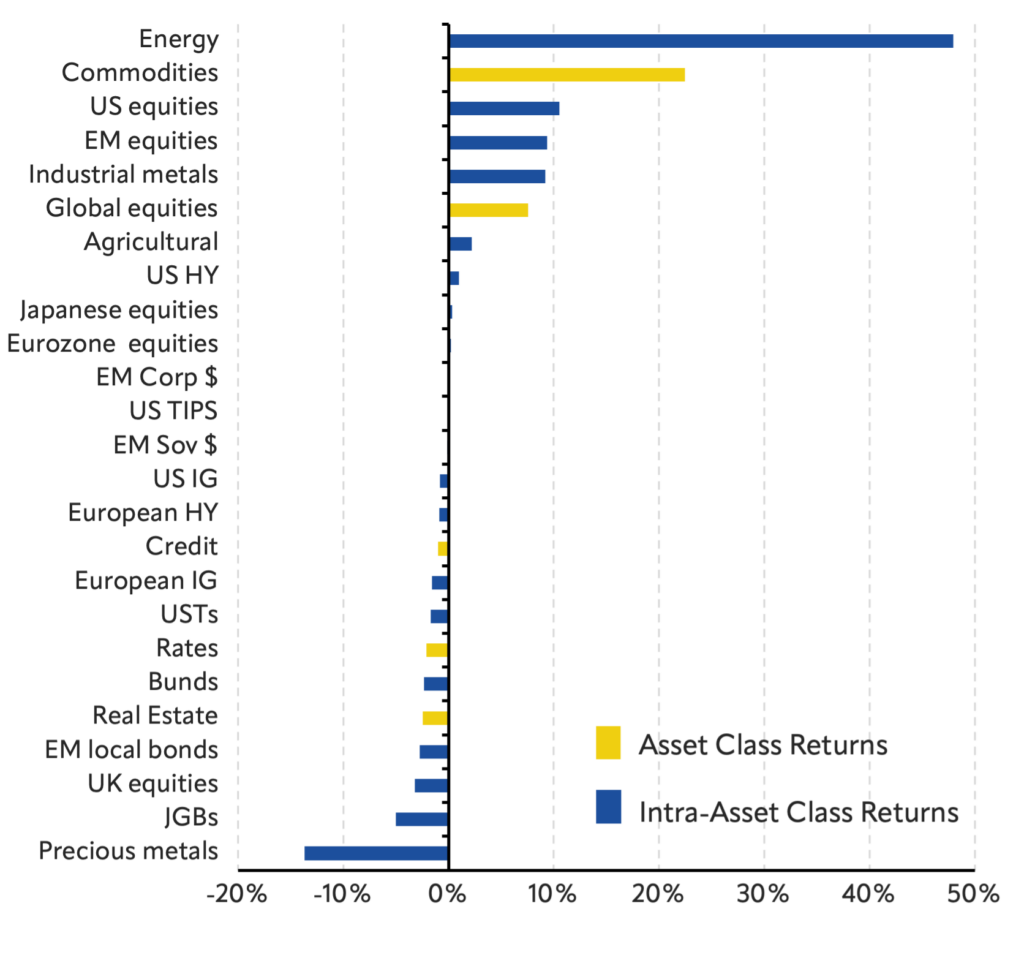
Source: Bloomberg
*The publication reflects asset performance up to May 29, 2026, and macro events and data releases up to June 4, 2026, unless indicated otherwise.
The information contained herein is obtained from sources believed by City of London Investment Management Company Limited to be accurate and reliable. No responsibility can be accepted under any circumstances for errors of fact or omission. Any forward looking statements or forecasts are based on assumptions and actual results may vary from any such statements or forecasts.